One of the biggest stories of the NFL offseason was the impending rollout of fast-paced offenses that would limit time between plays – and substitutions – in the name of putting the defense on its heels and racking up points like a college team. With Chip Kelly coming into the league bringing his high-flying Oregon offense and teams across the league finding success with no huddle offense the time seemed right for this style to sweep the league. Former NFL coach Nick Saban (I’m told he’s in a position of some note in college football) waded into the fray to suggest that fast-paced offenses might cause more injuries than traditional, pro-style offenses (worth looking at but not in this post).
Now that we’re more than a quarter of the way into the season it is time to check the record and see how much the game has really changed from year to year. Are fast-paced teams the vanguard of a new way to play NFL football – racking up yards on the scale of the Oregon Ducks or the early-90s Bills – or are they copycats blindly running through quicker 3 & outs because they aren’t good enough to copy those Ducks and last season’s fast-paced Patriots offense that led the league in speed and offensive efficiency?
Pace
First of all, we need to see if teams are actually speeding up relative to past years. Football Outsiders has a pace stat that excludes plays where the situation dictates the pace to look at how a team plays when they can do whatever they want that we’ll use to examine if the league is really changing[1]. As you would expect, in 2013 so far the biggest gaps between situation-neutral are for winless Jacksonville (4.7 seconds faster overall), the winless New York Giants (4.6 seconds) and the only-slighly-more-win-possessing Washington (4.3 seconds) as the score dictates that they play much more quickly than they would otherwise prefer.
The median team’s situation-neutral play from 2008 to 2013 is shown below.

The results are even more striking if we look at the individual teams. The figure below shows teams ranked from fastest to slowest for each season.

Every single position is faster in 2013 than 2012, although individual teams have changed in both directions. The Buffalo Bills made the biggest change and are playing 8.4 seconds faster this year than last. Philadelphia, home of Chip Kelly, brought their per-play time down by “only” 5.8 seconds but started from a faster base in Andy Reid’s offense and ended up with the fastest pace so far in 2013 at 23.4 seconds per play.
On the other end of things, two teams that don’t naturally leap to mind when you think of plodding, slow offenses hit the brakes hardest from 2012 to 2013. The New England Patriots (+1.9 seconds/play) and New Orleans Saints (+2.0 seconds/play) are the two of the biggest three increases so far year over year (Oakland leads the way at +2.4 seconds/play). The Patriots were the fastest team in the league in 2012 and stayed on the high end with the third-fastest pace so far in 2013. The Saints actually dropped into the bottom half of the league but I think there fans will take it given the overall improvement with Sean Payton back on the sidelines.
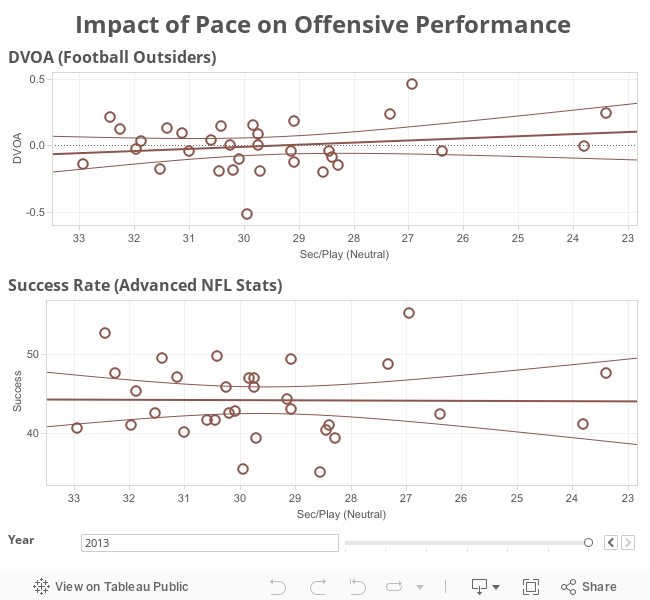
Impact
So it seems like we can clearly say that NFL offenses are playing faster than at any point in the recent past. What does it mean?
There are, unfortunately, a ton of ways we can look at how well an offense is functioning. We could look at yards per play, but that might reward teams with lots of early 3 and outs followed by some garbage time competence and conversely penalize teams who build up a lead and then run the ball to kill the clock. We could look at points per play, but scoring is lumpy and an offense might be functioning well except for that running back with a fumbling problem. We could look at length of drives in yards (depends on the starting position provided by the defense ) or plays (penalizes big plays) but those come with their own problems too.
Luckily for me both Brian Burke of AdvancedNFLStats.com and Aaron Schatz and team at FootballOutsiders.com have already thought of these issues and created two stats for context-dependent success of a play. Two yards on first down and ten to go is not success, but it is a success to gain two yards on third and one. This is the key we need to evaluate these situation-neutral pace stats in a context-dependent way that achieves peak-hyphen-efficiency.
Burke’s play success stat is based on whether a play increases the expected points of a drive (see the calculator here) based on the outcome of drives that have been in the same position historically. As an example, 1st & 10 from your own 30 with 10 minutes left in the first quarter is worth 0.9 points. 2nd & 10 from the same position is worth only 0.39 points. 2nd & 6 from the 34 is almost a success but turns out to be worth only 0.87 points; only a gain of 5 or more yards in that situation will be considered a success. Average team success rate comes in at 44% in the 2008-2013 period except 2012, when it was 44.53%.
DVOA, created by Football Outsiders, started from a base defining success as 45% of needed yards gained on first down, 60% on second down and 100% on third or fourth down. Since then the system has expanded somewhat to include factors for the randomness of fumble recoveries, minimizing the cost of late game desperation interceptions, increased weighting for red zone plays and even higher weighting for touchdowns. Over the 2008-2013 period the average team has a DVOA of approximately 0 (you probably could have figured that out if I had told you that DVOA was Defense-adjusted Value Over Average, but it’s always good to check).
I've been paying close attention to the pace of play in the NFL, and it's intriguing to see how game speed affects the whole fan experience. It reminds me of the accuracy required in academic work, just as my friend sought the best dissertation writing service to ensure their projects were thorough and on time. When striving for perfection, efficiency in football and academia frequently coincide.
ReplyDelete