In the wake of the Trent Richardson trade from Cleveland to Indianapolis, it seems like a lot of conventional wisdom holds that running backs are overpaid and teams are stupid to pay them a lot of money. Please enjoy some out of context tweets that support my assertion:
This Browns regime didn't draft Richardson, it's an era where fewer RBs going 1st round and if they don't value him that highly, makes sense
— Jason La Canfora (@JasonLaCanfora) September 18, 2013
also, on this Richardson deal, this had nothing to do with "scheme" or "fit." it was about value and upside evaluation on the Browns part
— Jason La Canfora (@JasonLaCanfora) September 19, 2013
Browns source says Richardson just wasn't a great fit, so getting a 1 was great value. Cleveland now has 2 1's, a 2, 2 3's and 2 4's in '14.
— Albert Breer (@AlbertBreer) September 18, 2013
Good move by Browns to get what they could for a player drafted too high.
— Steve Drake (@SteveDrake_) September 18, 2013
Ask yourself: if Trent Richardson were a 4th round pick, what would Indy have traded for him?
— Steve Drake (@SteveDrake_) September 18, 2013
Nervous that Cleveland, the team I grew up with except for those three years when they were gone and the subsequent years when they’ve been terrible, had made a mistake, I wanted to dig into the data and see about the “devaluation” of running backs in practice. Unfortunately for the timeliness of this post I did not have the data handy and had to construct the data set.
Working from a number of sources I duct taped together a data set that could serve my needs, tied name/team/year combinations to positions and stepped back to look at the result.


This does not fit my narrative. Fear not, though, because we haven’t yet taken into account the contemporary increase in the salary cap – so substantial in the 2003 to 2009 period.

I call this the hockey stick – is that already taken? I promise I came by it honestly, but there’s another adjustment to do so we can really see the change in RB spending.

Viewed as a percentage of team spending we can adjust for the changes in the cap AND teams’ behavior relative to that. The problem with this narrative now is that it doesn’t really go anywhere. Teams seemed like they were on a downward path from the 03-05 heights through 2011, but the numbers jumped substantially in 2012 even after adjusting for overall team spending.
Here we come to the duct-taped data set. There are 176 RBs in the 2011 set while there are 248 in 2012. This seems like (and is) a problem.

Here we go. After controlling for the change in the salary cap, the change in the percentage of the cap used by teams and the breadth of the data (no year had less than 154 RBs) we have our support. Teams do, in fact, spend a lower percentage of the salary cap on the running backs they used to and it’s at the lowest point in the last ten years.
Trent trade time
In the Trent Richardson trade the Colts have bought themselves a year and a half of a relatively medium-priced running back (21st in proportion of team spending among RBs in 2012) with mediocre results on the field. Lots of touchdowns but lots of games with a 3.5 average yards per carry number.
As noted by Chris Brown (better known as @smartfootball) the Colts believe they have a higher discount rate.
Browns/Colts trade a example of applying different discount rates to uncertain assets (TRich/pick). Colts want to win now/CLE bet on future
— Smart Football (@smartfootball) September 19, 2013
Higher than the Browns seems pretty safe. For it to be high enough for this trade they need to be in a position where the team is much more suited to winning now as opposed to winning in the future. This might be true but is more likely to be impatience. They have sacrificed a first round pick that will provide quality play at a low price in the 2014, 2015 and 2016 seasons (players on their rookie contract can renegotiate after their third season) for a player partway through his second year. When Luck and Richardson come calling for raises from their rookie deals following the 2014 season the Colts may just be wishing that they only had one new deal to wedge into their cap.
And all the data...
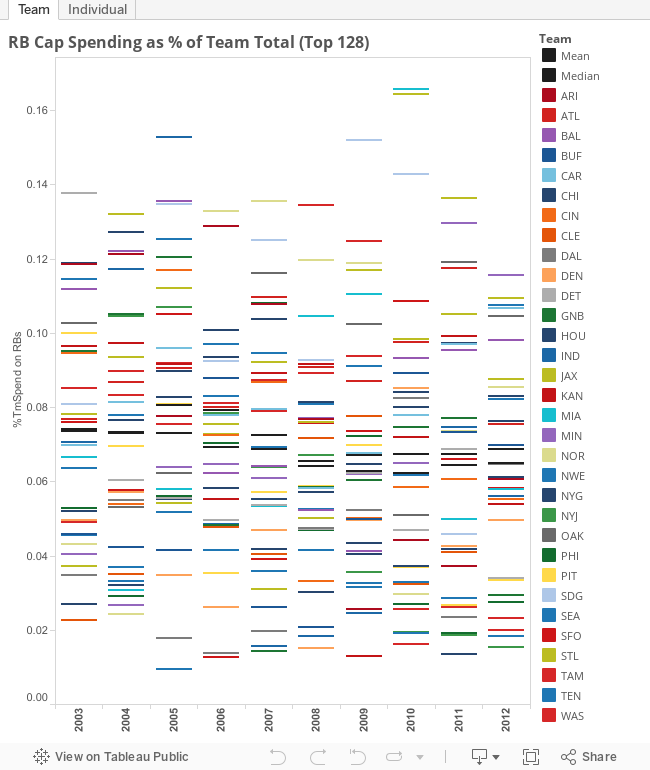
Finally, here’s another Tableau to play with. The top portion is the raw data behind the final bar chart in which each RB’s percentage of team spend is plotted by year. The bottom portion is the total team spending but again only on those same top 128 running backs.
No comments:
Post a Comment