Wednesday, May 7, 2014
NFL Draft Output by Position - Tableau
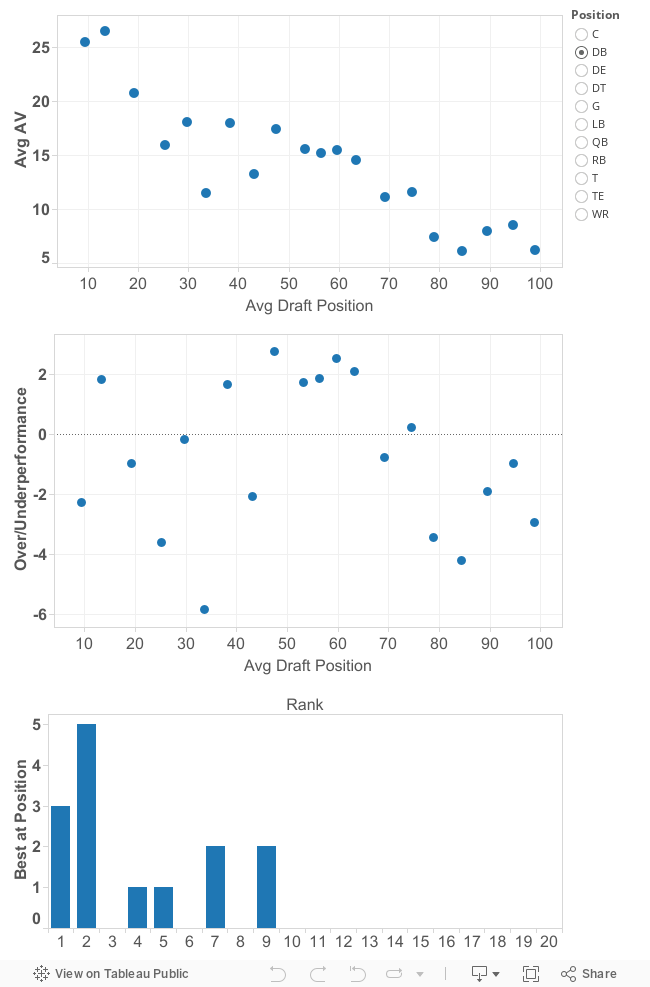
Just for fun, here's a visualization of the NFL Draft data that I talk about here and here.
A note on the AV calculation presented here - it's weighted by position based on the league's aggregate level of spending on starters (e.g., top 32 QBs, top 64 DTs, top 128 LBs) over the 2001 to 2012 period for which I have salary data. That approach gives TEs a pretty raw deal (-32%) since big deals have yet to trickle down despite a couple years of good performance, but makes a big positive adjustment to QBs (+61%) reflecting - accurately, I think - their importance in the league. Other than those two most adjustments are within +/- 10%.
Subscribe to:
Post Comments (Atom)
No comments:
Post a Comment