Monday, September 22, 2014

No league for old men


Back in December of last year I went through some calculations with the data set I stitched together including both performance and salary data. You can check the post out here for a series of simple graphs that go a long way toward explaining team behaviors and why certain things are the way they are in the NFL, particularly as they relate to player tenure and performance over time.

As I was reading through that post again recently, however, I was struck that it makes the implicit assumption (explicit above) that things are the way they are. What I mean is that this data is the average over a period of time, while there may in fact be some trends to observe by looking at the period year-by-year.

Charts


The average age of all NFL players[1] fluctuated between 26.5 and 27 for most of the post-1994 period (the salary cap era) before dropping from 2008 through 2013 almost without interruption. Applying a weight based on games played or games started, the other two lines on the chart, indicate that the pattern is consistent for the starters as well as the backups. NFL rosters are roughly half a year younger than they were from 94-08.

Wednesday, August 20, 2014

Are NBA teams getting better at drafting?


Looking back at the NBA Draft one can find some pretty egregious mistakes. Bill Simmons recently took a look at every NBA draft since 1995 and reordered them based on where his evaluation of the players’ careerssuggests they should have gone.

While I’m interested in this exercise – indeed I spent many minutes of my life reading his post on the subject – I have something a bit more rigorous in mind. I want to evaluate whether NBA decision makers have become more skillful at drafting.

Chase Stuart recently looked at this topic in the NFL, finding very little improvement, and my own research on the NFL Draft suggests that the relatively uniform level of skill means that extreme outcomes (e.g., a great draft class, the Browns) tend to be the result of luck. 

Methodology 

I’m trying to keep this as simple as possible while still being representative. Looking at entire careers is out because every single draft in my 1998-2013 data set features active players. At the risk of underrating a few picks in which the player was a late bloomer AND that late blooming was captured by the drafting team, I will look at the first four years for each player[1][2].

I am going to use win shares as a proxy for performance. This is due primarily to availability but also because they are a reasonable approximation of performance (though one with known flaws).

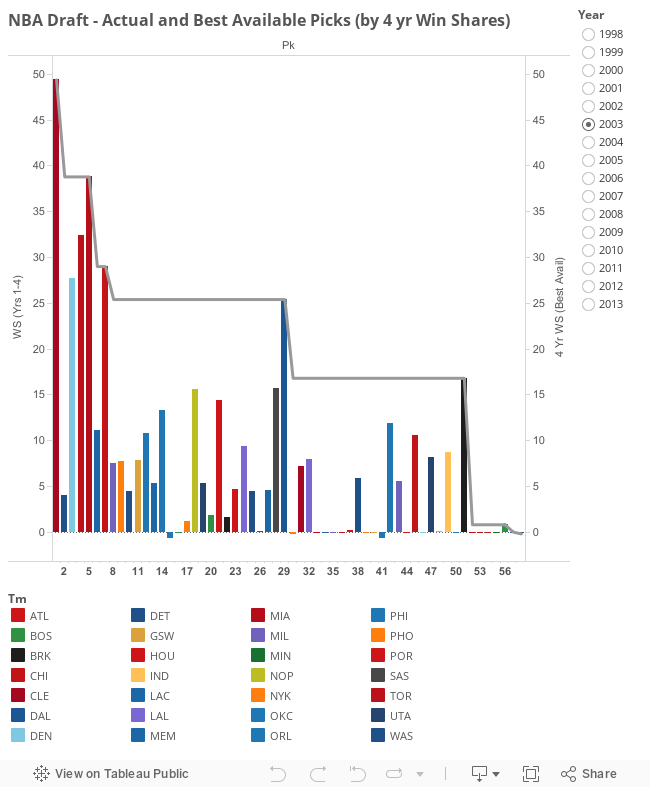
Now for the actual measurement methodology, which I feel is refreshingly straightforward. With the benefit of hindsight we know the best player on the board at any given pick. The proportion of the best available pick’s win shares delivered by the actual pick give us the score of that pick.

As an example, Derrick Favors (3rd pick, 2010 draft) accrued 16.1 win shares in his first 4 seasons. The best available player on the board – Paul George, 10th pick – had 29.7 win shares so Favors has a score of 54%. The Pacers' selection of George at number 10 would have a score of 100%. The higher the average score is for a given draft, the better the decision makers are doing selecting the best available player. 

Results 

We’ll look at the results in three different cuts to see if teams are getting better.

First, are they getting better in the lottery? This is the equivalent of a first round NFL pick, where players are expected to step in and start immediately with a realistic chance of an all-star appearance or two during their rookie deal.

Second, are they getting better in the first round? This has a certain elegance in that each team (barring trades) gets to make their one pick so even if a team is picking 28th, it’s their first shot in the draft and we could expect them to maximize the value of that pick.

Finally, are they getting better across all picks in the draft? It seems logical that we should look at the overall performance of teams at picking players.


Interestingly, the further we go into the draft, the more improvement we see from year to year.

A possible explanation here is that the rigor that used to be applied only to lottery picks has been extended further into the draft. In support of this explanation one could cite the technological progress that allows scouts to see innumerable prospects via YouTube rather than scouting them individually.

Alternatively, the data could be telling us elite organizations continue to pull away from the rest of the league. Those teams that put the best team on the court – and thus pick last in the draft – are now the same teams that have the best process in place to evaluate draft picks. This could come from better evaluation techniques or merely the ability to delay gratification in the case of selecting foreign players who cannot come to the NBA immediately.

I’m inclined to put more stock in the first explanation over the second, but distinguishing between the two is a topic for another day (or for the comments section).

-- For those of you who made it to the end, have a visualization of all picks from 1998 to 2013 with a reference line for best available player:


[1] This is also based on the current structure of rookie contracts. There are team options for the 3rd and 4th year, as well as a qualifying offer that can give the team the right to match any offer made to the player for a new contract beginning in their 5th season. To make sure we still have a usable, relatively current data set, we’ll use the first 4 seasons.  
[2] It’s probably not ok, from a style guide perspective, to go with double footnotes, but this is about a different thing. An acknowledgement here that several foreign players selected in the draft in the years we’ll be using are either still not in the NBA or have not yet finished their first 4 seasons. Not much can be done about it but it likely makes some late 1st round and 2nd round picks look worse than they are. Those teams took a defensible shot with their picks and either couldn’t convince the player to come over or knew there would be a couple years before they would move to the NBA.

Tuesday, June 24, 2014

The 2013 NBA Draft was historically bad


As the 2014 draft approaches, I thought it might be interesting to look back at last year’s version to see just how bad it was.


All Draft Picks - 1st Season
Year
Win Shares
Minutes Played
1998
56.9
40,838
1999
56.0
35,790
2000
32.2
33,170
2001
57.2
41,005
2002
39.5
33,039
2003
48.7
40,515
2004
58.7
40,391
2005
64.6
42,957
2006
50.5
37,159
2007
43.8
37,499
2008
79.7
50,720
2009
74.3
48,425
2010
40.4
33,951
2011
63.0
48,380
2012
53.6
40,967
2013
34.7
32,635
98-12 Avg
54.6
40,320


The top line numbers don’t look so good. From 1998 to 2012, the draft class averaged 55 win shares in their first season. The 2013 total was 34.7. Only the 2000 draft – featuring the murderer’s row of Kenyon Martin, Stromile Swift, Darius Miles, Marcus Fizer and Mike Miller as a top five – pulled in a lower total with 32.2 win shares as rookies.

If we restrict the measurement to just the top 10 players selected in each draft, the 2000 edition is still the lowest of the 98-12 period with 13.5 win shares. The 2013 draft comes in with only 7.4 and less than a third of the 15 year average of 26. The gap between an average top 10 and the 2013 top 10 is basically the entire gap between the overall average and the full 2013 draft.

For those who don’t like win shares we can check out an even more basic measure: minutes played. 2013 is the lowest in minutes played for both the full draft and the top 10 only.


Top 10 Picks - 1st Season
Year
Win Shares
Minutes Played
1998
36.4
20,354
1999
37.2
18,980
2000
13.5
14,723
2001
24.6
16,139
2002
28.9
18,391
2003
28.5
19,471
2004
32.2
16,763
2005
35.1
18,193
2006
15.8
14,112
2007
15.1
15,233
2008
35.8
21,059
2009
24.5
15,492
2010
21.4
17,503
2011
16.0
15,981
2012
24.9
17,553
2013
7.4
11,755
98-12 Avg
26.0
17,330


Finally, here are a couple graphs showing the cumulative build-up of win shares for 2013 compared to the average and the extremes from 1998-2012.

As mentioned above, the 2013 draft looks especially bad when you look at the performance of picks in the order selected (2nd chart). The top part of the first round was less than a quarter of the 2008 draft while the first several picks lacked anyone who could come in and deliver performance anywhere near expected. Given Anthony Bennett's negative win share total and middling totals of 1-2 for most of the other top picks, Nerlens Noel looks like the big hope from this group to have any elite players.

For those wondering, the top 5 2013 picks for win shares were Mason Plumlee (uh oh) with 4.7, Tim Hardaway with 3.1, Steven Adams and Kelly Olynyk at 2.9 and Cody Zeller with 2.6. It's hard to see who among this group will become a regular all star.

Given the hype for the 2014 class it seems more likely we'll be comparing it to the 2008 version than last year's. GMs in the lottery certainly hope so.