Showing posts with label Approximate Value. Show all posts
Showing posts with label Approximate Value. Show all posts
Monday, December 2, 2013
Player performance curves and value for money
As mentioned in this space recently, I am the proud owner of a shiny new database full of player performance and salary data from 2003 to 2009. I will be trying to extend it in both directions as I have time. For now, however, the analysis will be applicable to that period’s decisions. Once 2010-2012 are added in it might provide a nice contrast in allocation and relative performance under the conditions of the new CBA.
The jumping off point for this data set is getting a good baseline on the efficiency of spending in the NFL. How much does it cost to squeeze one unit of Approximate Value[1] out of a given position? Approximate Value is a stat from Pro-Football-Reference.com developed by Doug Drinen that works by allocating out a team’s offensive and defensive performance to different positions based on various assumptions. The summaries Doug has produced introducing the stat are extremely helpful, but you won’t be at too much of a disadvantage if you just read on without understanding exactly how AV works. As he says in the introduction they are “simple, intuitive and approximate."
Methodology
In the post I wrote about spending on running backs (see here for more) I noted that prior to the current, 2011, collective bargaining agreement, teams frequently failed to spend up to the level allowed under the salary cap. To correct for this, I represented allocation decisions in terms of percentage of team spending. This way you have a team like the 2005 Seattle Seahawks who spent $67 million against the cap give or take a few while they were permitted to get up to $85.5 million. The $0.75 million cap number for Isaiah Kacyvenski – a fine linebacker and fellow 2011 Harvard Business School grad – would be 0.9% of the salary cap but the 1.1% of team spending is a better representation of the allocation decision. The assumption here is that teams were working under a budget set externally (owner, rather than salary cap) and that they had to allocate those scarce dollars according to that budget. If you still have a problem with this approach please do check out that article I referenced earlier.
Wednesday, November 27, 2013
A new toy
I have spent a decent amount of time over the past few months building up a list of season-by-season player performance that ties to salary cap numbers. Due to this (and laziness, and having and wanting to keep my job) I have not produced as many posts this fall as I normally do. In the next few weeks I will start extracting (hopefully) interesting posts from it while also continuing to refine the data as errors become clear.
The data set is neither perfect nor comprehensive. It covers the key players for a period in which I could find good data on salaries via the USA Today database. The relatively manual nature of matching individuals who fail out of the automated linking led me to prioritize matching those with significant playing time over some who may have drifted into the league for a game or two.
Out of 44,866 “units” of Approximate Value from 2003 through 2009, all but 488 are tied to players who have a salary linked. On the salary side $18,017,691,274 in cap numbers are accounted for out of a total of $19,144,980,923. Finally, all but 29 of the 5442 player seasons as a starter have a matching salary.
Within the “matched” data there are sure to be errors at the individual player level – the USA Today salary database is only so accurate – but the data will provide opportunities for a wide variety of analyses along dimensions of age, position and tenure in the league.
Monday, September 9, 2013
Fun with Tableau - How well do NFL teams know their own players?
I am working on a post examining how well teams know their own assets by looking at the difference in performance of players who stay with the same team and those who go to a different team. This post is still a ways from being ready.
In the meantime, however, I decided to play around with Tableau and put together a visualization of the raw data. Play around with it to draw your own conclusions:
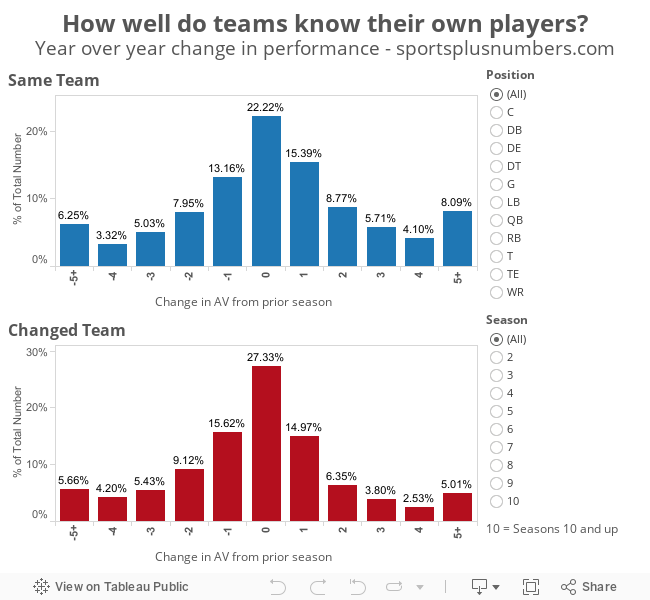 For those of you not familiar with Approximate Value, see the background here.
Average performance (denominated in AV) of different levels since 1994:
Non-Starter: 1.2
Starter: 6.6
Pro Bowler: 11.6
All Pro: 14.4
In the meantime, however, I decided to play around with Tableau and put together a visualization of the raw data. Play around with it to draw your own conclusions:
Average performance (denominated in AV) of different levels since 1994:
Non-Starter: 1.2
Starter: 6.6
Pro Bowler: 11.6
All Pro: 14.4
Subscribe to:
Posts (Atom)