Showing posts with label Economics. Show all posts

Tuesday, January 19, 2016

Thoughts on my college bowl pool

For the second year in a row I participated in an against-the-spread contest with some high school friends for the college bowl season. For the second year in a row I didn’t win (15/16 this year, 4/25 last year).

I did, however, get some good anecdotes:

Familiarity

This group of people mainly from Columbus, Ohio and mainly living in the Midwest still has a bit of a Big Ten problem. Last year the group was 15% more confident in games involving Big Ten teams than games not involving them while underperforming against the spread – the ATS win percentage was 47.2% for these games and 48.2% for non-Big Ten games.

This year the group was 17% more confident when a Big Ten team was involved while managing to win 48.8% of them. The win percentage on non-Big Ten games was 53.4%.

Confidence

Last year the group was overconfident in what turned into losses, betting 21.0 points against 19.5 on games they ended up picking correctly. This year was flipped with the wins worth 21.6 while losses were 20.6.

As is evident in the chart below, however, there was no correlation between confidence and success.


Confidence (pt. 2)

The game with the highest confidence was (inexplicably) the Outback Bowl between Northwestern and Tennessee featuring 13 out of 16 people picking the wrong team and an average confidence of 30.4. The least confident game was San Jose State vs. Georgia State with 9 of 16 teams picking correctly at an average confidence of 8.9.

Confidence (pt. 3)

After assigning the national championship game the lowest aggregate wager last year (8.8 out of 39), this year people were feeling a bit more lucky and gave it a higher risk than 8 other bowls (16.4 out of 41) despite not knowing which two teams would be contesting the game.

14 of 16 got the Orange Bowl right while only 2 of 16 got the Cotton Bowl correct (Big Ten) with 11 of the 16 ending up with a viable championship game pick (5 Clemson, 6 Alabama). The Alabama picks were worth 19.8 – above the 14.3 for losers – so maybe those people were on to something.
Thursday, November 5, 2015

Searching for sunk costs: UFAs vs. 7th round picks

In my last post I looked at the propensity for coaches to disproportionately use players drafted highly. Higher draft picks play slightly more than their underlying ability (i.e., performance over the next few seasons) would predict. In this post I want to take a quick look at whether this same effect is visible at the margin between 7th round draft picks and undrafted free agents.

The underlying assumption here is that 7th round picks are not all that different from undrafted free agents who get a look from teams. While I would love to be able to validate that assumption with some data, we don’t exactly have those populations in our available data. What we can compare is 7th round picks who have made NFL rosters to undrafted free agents who have made NFL rosters. As I noted in my previous post on this topic, this obscures the most likely place for this bias to manifest itself – decisions on who makes the roster – but can’t really be helped.

Approach

From 1994 through 2010[1] we have 2,043 undrafted free agents and 540 7th round picks who made NFL rosters in at least one season. This analysis will compare their playing time – games started are equal to 1 and games played but not started vary by position as a proportion of games started – with two factors: whether they were drafted or not and how well they played over the next 3 seasons. Performance over the next 3 seasons serves as a proxy for underlying skill. I am using the square root of that performance because I want to weight the player who has a 3 year line like 1-2-13 close to the player whose line is 9-10-8. I am assuming that both have a similar level of skill but the 1-2-13 player may have been blocked from starting or overlooked because he was undrafted.

Results

As with the other analysis, it’s important to note first of all that the relationship here is not that meaningful (R = 0.36, R^2 = 0.13). For players who never play another season in the NFL, an undrafted one is expected to play the equivalent of 2.69 games while a 7th round pick would be expected to play 3.01. Being drafted alone moves the expectation by 0.32 games (p-value 0.03), more than 10% of the baseline. Compared to underlying skill, however, being drafted is much less meaningful. For the hypothetical “1-2-13” player above, underlying skill adds 3.29 games to the expectation (coefficient is 0.82 per unit, p-value 0.00).

Moving to players in their 2nd season the effect of being drafted goes away completely (p-value 0.99) while underlying skill becomes more powerful (coefficient is 1.12 per unit, p-value 0.00).

Based on this analysis I am pretty confident that there is a weak positive effect of being drafted on playing time for rookies. Given the way it evaporates in the second season I would not be surprised if it is strongest early in the first season on a per-game basis. I still believe there is a larger effect that is hidden by lack of data in terms of roster decisions. If anyone has any idea how to get at this question, feel free to let me know.


[1] For this analysis only players with at least 3 subsequent seasons possible (whether played or not) are eligible

Monday, May 11, 2015

Sunk cost and the NFL Draft

I’ve looked at the NFL Draft a lot since starting this blog. As the draft was here in Chicago this year, I found myself running into a number of jerseys on the street when I went out for lunch on Thursday and Friday. Even more surprising than the fact that people had travelled – in some cases from pretty far away according to the jerseys – was the fact that a lot of them were wearing jerseys of players who were disappointments if not outright busts. It got me thinking about sunk costs and whether teams are any better than their fans about cutting their losses.

To try to get at this we’ll need to know how much teams value their draft picks – conveniently we do know this via the Jimmy Johnson-popularized draft value chart – and then compare this to how much those players are used. Usage is a bit tricky but I’m going to approximate it with games started (1 full game) plus games played (2014 avg snaps non-starter / 2014 avg snaps starter, by position).

Before even getting to questions of usage, there is a significant disparity in the proportion of players from each round who end up making a roster.

Round
% on Roster Year 1
1
97%
2
94%
3
83%
4
81%
5
70%
6
62%
7
52%

I am guessing that most of this comes down to talent disparity, but there is certainly some aspect of sunk cost at work here. Lots of later round picks – to say nothing of undrafted players – never make it onto a roster to get into the rest of this analysis. They are, however, not the topic of this analysis. I want to see if a player’s draft value still impacts playing time even after making a roster.

The first cut of this is simply to look at draft weight and usage, checking how much the former impacts the latter. The regressions for each of a player’s first 6 seasons are below:

Usage vs Draft Weight


Draft Weight
Year
R^2
Intercept
Coefficient
P-Value
1
0.22
4.53
15.87
0.00
2
0.16
6.88
13.87
0.00
3
0.10
8.10
10.71
0.00
4
0.08
8.84
9.18
0.00
5
0.05
9.49
6.58
0.00
6
0.04
9.88
6.14
0.00

The draft weight is a significant variable throughout the first 6 years of a player’s career, but the strength of that relationship declines over time. The 1st year model explains 22% of the variation in usage while the 6th year model explains just 4%.

Tuesday, July 9, 2013

NBA draft picks as assets – the triumph of hope over experience?


Zach Lowe had an article up today on Grantland about the current view around the NBA that draft picks are extremely valuable assets for teams to stockpile and use in future trades. He explains:
The word "asset" has never had more currency in the NBA. Draft picks, even in the 20s, are "assets" teams can use to acquire cheap talent, or to grease the wheels in potential mega-trades for star players. The Celtics view the three unprotected picks they nabbed from the spend-spend-spend Nets not just as young players that will don the hallowed green, but as "assets" carrying the lure of the unknown for a rival GM looking to move a disgruntled star.
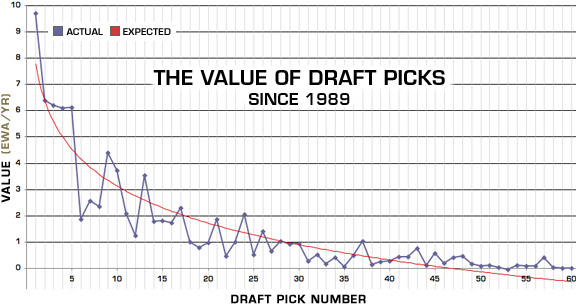
Luckily for us, someone has already gone to the trouble of valuing NBA draft picks and the results should be sobering to teams clutching likely mid- to late-first round picks and hoping for the next Tony Parker.

Source: ESPN.com


Even teams holding picks they think will be at the top of the draft should look carefully at the rate of team performance mean reversion in the NBA (see this post from last year) and be realistic about where the pick will be.

I can see two primary reasons for the run-up in value of picks relative to real, actual players - besides the momentum of "everyone is doing it."

  1. The 2011 CBA – The NBA went to a lot of trouble, and cancelled a lot of games, to get a very owner-friendly collective bargaining agreement in their latest negotiations.

Monday, June 24, 2013

Sports Gini: Inequality within major sports leagues


The Gini coefficient is a way to measure the level of income equality in a country. It is calculated by plotting cumulative incomes in ascending order and measuring the gap between the resulting curve and the straight line that results from taking the average income in each instance. This sounds much more complicated than it is (but you can read more about it here).

Here is an example where total income is 100. The red area is the cumulative income. The blue area represents the gap between cumulative income and perfect equality of income.

A country with a Gini coefficient of 0 would have no blue area visible, as the income for each individual is the same so the cumulative income function looks the same as the straight line average income function. Perfect inequality, on the other hand, would have virtually no red visible as all but one of the people earns nothing and the other person earns something.

In the real world, countries tend to fall between 0.25 or so on the low (equal) side and 0.6-0.7 on the high (unequal) side. The lower countries tend to be Scandanavian or Eastern European while the highest are often African or Latin American countries.

Let’s take a look at the Gini for team revenue in the Big 4 US sports leagues[1]: NFL, MLB, NBA and NHL.


Monday, February 18, 2013

Talent Markets in Sports – The value of the Franchise tag


The following is adapted and expanded from my exceptionally and exasperatingly long read on the NFL Draft Value Chart - I'm not sure anyone has made it to the end so I am excerpting key parts when I am too lazy to write a new post.
 

After seeing Andrew Brandt (a must-follow on Twitter @adbrandt) refer to an espn.com article he wrote last summer on the Franchise tag, I thought I would dust off a portion of my NFL Draft behemoth and jump on the bandwagon. 
Each of the three major American sports leagues (with apologies to the Raptors and Blue Jays, and hockey) has a particular way of dealing with their markets for talent. By looking at the comparison we can see some of the sources of value for players and owners - and the massive negotiating advantage that is the Franchise tag.


Baseball – Good for veterans


Baseball allocates the first six years of a player’s Major League career to the team. Arbitration means that the player has some leverage to improve their situation – particularly in later years – but they still receive a salary below their market rate during this period. Once they have completed their first six seasons a player is a free agent in the truest sense. Any team can offer him a contract for any amount or length of seasons. The result of this structure is that the Winner’s Curse tends to play out for in-demand free agents and surplus value to the team is not likely to be found in players outside of their arbitration years.

Friday, January 25, 2013

NPR says LeBron is overpaid


An NPR segment went around this morning on why LeBron James makes less than he should. To this I say “what took so long?”


The NBA has had an individual salary cap in place since the 1999 collective bargaining agreement between the players and owners. By definition this provided top players with less than they “deserved” because otherwise it would be unnecessary.


Given a relatively normal distribution of talent (or at least the right-most part of it) there are a few superstars who are far and away better than all other players in the league. In competitive bidding they would exceed even the lofty value they provide due to the Winner’s Curse which results in auctions going to the bidder most optimistic about the value of the asset.


As an example, Michael Jordan earned in excess of $33 million for the 1997-98 season when the league average was $1.4 million. In 2012-13 the average is up to roughly $5 million while the highest in the league is Kobe Bryant at almost $28 million. The ratio has gone from 20x to just over 5x since the introduction of the individual salary cap and Jordan never really faced competitive bidding for his services so the real ratio may have been higher.


Maybe the real story is that NPR is now covering basketball. I blame the Brooklyn Nets.

Tuesday, November 13, 2012

What are NFL draft picks really worth (and do they help teams win)?


One of the biggest moments in the history of the NFL Draft took place almost as far from it as possible. On October 12, 1989 – 171 days after Everett Ross became Mr. Irrelevant as the last pick of the 1989 Draft and 192 days before Jeff George kicked off the 1990 edition – the Dallas Cowboys sent Herschel Walker and a handful of picks (two 3rd rounders, a 5th and a 10th) to the Minnesota Vikings in exchange for five players, three 1st round picks, three 2nd round picks, a 3rd round pick and a 6th round pick. Dallas’ multiple 1990s Super Bowl runs were powered by players such as Emmitt Smith, Russell Maryland, Alvin Harper and Darren Woodson who either came directly from the picks or as a result of further trades involving those picks.

Mike McCoy, who owned approximately 5% of the team, had been a business partner of majority owner Jerry Jones in the oil business. The team was looking for a way to systematically value their cache of draft picks, and McCoy was the one to do it. According to a 2004 Dallas Morning News article, McCoy spent two days graphing the actual trades that had taken place over the past four years. He found that the trades appeared to fit a trendline overlaid on the graph. This trendline became the basis for the Draft Value Chart[1].

The Chart provides a value for each pick in the form of unitless “points” assigned decreasing from 3000 for the number one overall to, depending on which source you consult, 0.4 points for the 256th pick or 2 points for the 224th pick[2]. The decrease in point values is extremely steep at the top of the draft with the value dropping by 50% to the 7th pick and by another 50% to the 24th pick, leaving it only 25% as valuable as the number one selection for trade purposes.

Since the early 1990s the Draft Value Chart has made its way through the NFL and become the basis for draft pick value on nearly every team. The assistant coaches and assorted front office employees from the Cowboys took it around the league when they left the team. Research conducted by Cade Massey and Richard Thaler plotting actual trades found that prices aligned closely to The Chart with the deviation from the chart dropping significantly and trade volume increasing in the years after it became well known[3]. In other words, once the chart became widely accepted teams did not vary from the assigned values.

Tuesday, March 27, 2012

The Winner's Curse


As the funstravaganza (not a real word) that is NFL free agency winds down, I am reminded again that there is a structural reason that free agent contracts in every sport pay more than players are “worth.” It turns out that the reason is slightly more complicated than: The owners are all crazy (though it still explains why Daniel Snyder, in particular, is crazy). The exception to this is the late 1980s in baseball, when owners agreed to simply not offer contracts to free agents from other teams. This actually happened, you can look it up. It bears mentioning that if this were attempted today, the internet would melt.