Tuesday, July 9, 2013

NBA draft picks as assets – the triumph of hope over experience?


Zach Lowe had an article up today on Grantland about the current view around the NBA that draft picks are extremely valuable assets for teams to stockpile and use in future trades. He explains:
The word "asset" has never had more currency in the NBA. Draft picks, even in the 20s, are "assets" teams can use to acquire cheap talent, or to grease the wheels in potential mega-trades for star players. The Celtics view the three unprotected picks they nabbed from the spend-spend-spend Nets not just as young players that will don the hallowed green, but as "assets" carrying the lure of the unknown for a rival GM looking to move a disgruntled star.
Luckily for us, someone has already gone to the trouble of valuing NBA draft picks and the results should be sobering to teams clutching likely mid- to late-first round picks and hoping for the next Tony Parker.
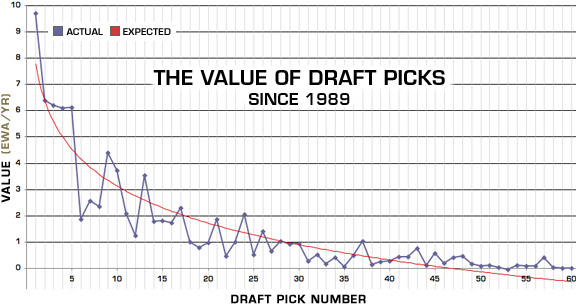
Source: ESPN.com


Even teams holding picks they think will be at the top of the draft should look carefully at the rate of team performance mean reversion in the NBA (see this post from last year) and be realistic about where the pick will be.

I can see two primary reasons for the run-up in value of picks relative to real, actual players - besides the momentum of "everyone is doing it."

  1. The 2011 CBA – The NBA went to a lot of trouble, and cancelled a lot of games, to get a very owner-friendly collective bargaining agreement in their latest negotiations.

Monday, June 24, 2013

Sports Gini: Inequality within major sports leagues


The Gini coefficient is a way to measure the level of income equality in a country. It is calculated by plotting cumulative incomes in ascending order and measuring the gap between the resulting curve and the straight line that results from taking the average income in each instance. This sounds much more complicated than it is (but you can read more about it here).

Here is an example where total income is 100. The red area is the cumulative income. The blue area represents the gap between cumulative income and perfect equality of income.

A country with a Gini coefficient of 0 would have no blue area visible, as the income for each individual is the same so the cumulative income function looks the same as the straight line average income function. Perfect inequality, on the other hand, would have virtually no red visible as all but one of the people earns nothing and the other person earns something.

In the real world, countries tend to fall between 0.25 or so on the low (equal) side and 0.6-0.7 on the high (unequal) side. The lower countries tend to be Scandanavian or Eastern European while the highest are often African or Latin American countries.

Let’s take a look at the Gini for team revenue in the Big 4 US sports leagues[1]: NFL, MLB, NBA and NHL.


Tuesday, June 11, 2013

Small Ball - Do lighter and/or shorter NBA teams have different winning percentages?


After watching the Pacers hang with the Heat through seven games on the strength of Roy Hibbert and David West pushing the smaller Miami defenders around – and having significant concerns about Nerlens Noel and his 206 lbs. coming to Cleveland with the number one pick – I want to look at the impact of weight on team performance.

I will weight the player weights by minutes played to put an average size on the lineups being rolled out by each team throughout the season and limit myself to the past five seasons so I don’t have to steal too much data from www.basketball-reference.com

Promisingly for Nerlens Noel’s prospects, the weight of the average lineup appears to have almost no correlation with winning percentage (0.05), ORtg (0.08) or DRtg (0.002). Statistics related to playing inside, as you would expect for a heavier team, show bulkier, more substantial correlations: turnover percentage (0.36), ORB% (0.25) and FT/FGA (0.23). The fatter huskier teams also failed to distinguish themselves in attendance with a negative correlation coming in at -0.10.


The distribution of teams is about as close to the textbook definition of random data as you can get. In fact, here is the distribution of random normal data recentered to the mean/standard deviation of the NBA data.


On the other easy-to-visualize metric of team physical appearance – height – there is a similar lack of relationship with the key metrics. Correlation with winning percentage (0.01), ORtg (0.11) and DRtg (0.09) is in the vicinity of perfectly unrelated – the mild improvement in offensive performance of taller teams is offset by an equally mild decrease in defensive performance (lower DRtg is better). Height has a hefty correlation with ORB% (0.28) similar to weight’s correlation with that metric, but the TOV% (0.11) and FT/FGA (0.12) correlations are much slimmer than those for weight.


In the current NBA Finals matchup between the Spurs and the Heat, the season-average lineups for the two teams have the Spurs outweighing the Heat 217.5 to 215.9 pounds (about 0.4 standard deviations) while San Antonio's height advantage is 78.76 with Miami averaging 78.43 inches (a difference of 0.75 standard deviations).

All in all this analysis doesn’t deliver the big insights I was hoping for, but does allow me to unload a small number of weight-related puns. For that I am grateful.
 

Tuesday, May 21, 2013

Luck vs Skill - Are picks after trading up better than others?


As some of you have no doubt noticed I have spent my last few posts looking at the level of skill involved in the NFL draft. Whether it’s year-over-year or individual selections in the same year, I have had no luck finding an outcome in which skill appeared to play a significant role.  

For my third cut at the subject I am trying a narrower focus in search of skill: draft day trades. Specifically, I will be looking at the highest pick involved in each draft day trade. These trades ought to show us the picks about which decision makers were most confident. They had to offer enough compensation to the pick’s owner to induce them to trade and they did it with a specific player in mind. Though these trades include all transactions on the day of the draft, a great majority of them were consummated during the selection window, only when that pick granted the right to a specific player the team trading up desired.

Thanks to the fantastic website www.prosportstransactions.com I was able to work quickly through the data collection phase and identify those trades that took place on draft days from 1994 to 2006, the same period as my previous post. After working through the details[1] we are ready to go.

That value chart is irrelevant because teams are trading for specific players

 
Long story short: there is still nothing to see here. Out of 245 picks in the data set, 108 were “good” according to the value expected by the Sports + Numbers draft value chart. Given the distribution of picks we would have expected 104. Not a good sign to start.
 

The individual p-values are nothing remarkable and those of rounds 3 through 5, flirting with a whole 50% chance of non-random difference from average, could be substantially undone by a single additional bad pick, their values retreating to 83%, 79% and 77%, respectively. These are not robust findings of skillful GMs swindling their dimmer peers for an overlooked gem.  

One of the more common retorts of those confronted with a trade that looks unfavorable according to the draft value chart (any of the draft value charts) is that teams are trading for specific players rather than some nebulous conception of value – so the trade can’t be evaluated by those fancy charts. The results of this analysis directly contradict that interpretation of trades because the players selected after trades appear to be as successful (or unsuccessful) in the league as those selected in the normal course of the draft. Therefore, the value chart seems like a pretty good way to deal with trade evaluation.  

Top picks too  

A few peeks at the early first round trade up picks might help head off some of the “..but what about ____?” comments.

Cutting up expected success rates by round is somewhat arbitrary, as I noted in my earlier post, so would it make a difference if we just look at the really high picks? The overall first round expected success is 51.6% while the top 10, including both traded and non-traded picks, comes in at 50.8% even against much higher expected value (see all the details here).  

The 17 top 10 picks that were traded only feature 7 (41%) that turned out to be good picks. While some of the good ones were very good (Eli Manning, Walter Jones, Champ Bailey) some of the bad ones were very bad (Ki-Jana Carter, Trev Alberts, Jonathan Sullivan).

Expanding out to the full first round for a bigger sample, the average surplus of the trade up group of is 5.08% while the non-trade up group comes in at 4.21%[2]. This difference in performance is worth just over $1 million in career salary cap value. It’s not nothing, but it’s not much spread over the average 8+ year careers of these players (some of whom are still playing). In terms of draft picks it is worth something like the 240th pick, a mid-7th rounder.


[1] I included the top pick involved in picks for picks transactions or players and picks for picks transactions, provided the side with a player on it did not have the highest pick among those transacted. I also included pre-draft trades of the number one pick – and mid-draft trades of Eli Manning – because the team selecting first gets their choice of player and I assumed that they had one in mind. The higher pick is the only one included in the data set. The evaluation of a “good” pick depends only on the production of that pick relative to the expectation and not on the players eventually selected with whatever was traded away. That is more than enough fine print for one post.

[2] The difference is positive for both because the last several years of drafts are not included, where players have had shorter careers that depress the total value in the full set. I’m working on some revisions to my value chart that will take the growth curve into account and get at a better estimate of total career value.

Friday, May 10, 2013

Luck vs Skill - Is anyone good at picking football players?


A couple of weeks ago I took a look at the randomness in NFL Draft results, prompted by articles from Brian Burke and Chase Stuart on advancednflstats.com and footballperspective.com, respectively. I found some slim evidence for skill in drafting – the streaks of drafts with outperformance were slightly longer than expected. Interestingly there was much stronger evidence that some teams are not good at drafting, but you can read that post to get the details there.
 
The year-over-year data, however, has a major issue that I mentioned in the post: it’s not the same people making the decisions. Looking at the picks made by the Browns in 2012 and those made in 2013 provides no insight because the regime had turned over in the interim. Above and beyond that, the competitors do not behave similarly year to year so the decisions of each team – the variable we are trying to evaluate – are mixed in with changes in the way that other teams decide.

 
In response to these problems it seems like a study of the picks within a single year would be the place to look. The premise is that any team that has made a good pick should be more likely to make a good pick with their selection. If the initial pick reveals anything about their skill level, the subsequent success rate will exceed that of teams with a miss on their previous selection.

 
Using my data set of draft performance in the salary cap era[1] and my analysis of what a draft pick is really worth, we can quickly look at which picks were successful by identifying the ones that delivered more than the expected value. The percentage of picks that are successful varies widely by round due to scouting focus and the binary outcomes in later rounds[2]. If a player makes it and stays in the league for a couple seasons, they probably generate enough value to be a success because the expected return is so low in later rounds. Most of the picks in these rounds wash out: 269 of the 569 7th round picks play 1 season or less, and a grand total of 0 of them delivered value in excess of their expectation.