Thursday, October 3, 2013

Nobody spends money on running backs, right?


In the wake of the Trent Richardson trade from Cleveland to Indianapolis, it seems like a lot of conventional wisdom holds that running backs are overpaid and teams are stupid to pay them a lot of money. Please enjoy some out of context tweets that support my assertion:


Nervous that Cleveland, the team I grew up with except for those three years when they were gone and the subsequent years when they’ve been terrible, had made a mistake, I wanted to dig into the data and see about the “devaluation” of running backs in practice. Unfortunately for the timeliness of this post I did not have the data handy and had to construct the data set.

Working from a number of sources I duct taped together a data set that could serve my needs, tied name/team/year combinations to positions and stepped back to look at the result.


This does not fit my narrative. Fear not, though, because we haven’t yet taken into account the contemporary increase in the salary cap – so substantial in the 2003 to 2009 period.
Monday, September 9, 2013

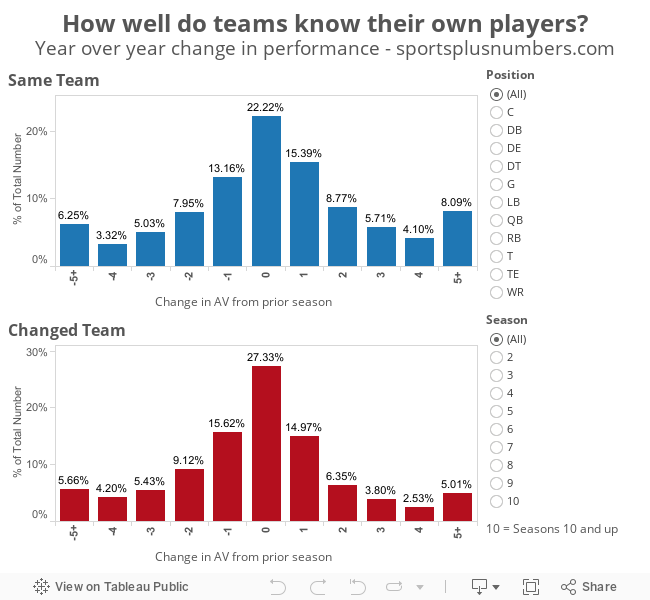
Fun with Tableau - How well do NFL teams know their own players?

I am working on a post examining how well teams know their own assets by looking at the difference in performance of players who stay with the same team and those who go to a different team. This post is still a ways from being ready.

In the meantime, however, I decided to play around with Tableau and put together a visualization of the raw data. Play around with it to draw your own conclusions:


For those of you not familiar with Approximate Value, see the background here.

Average performance (denominated in AV) of different levels since 1994:
Non-Starter: 1.2
Starter: 6.6
Pro Bowler: 11.6
All Pro: 14.4

Third-year NFL players and the new rookie contract system


One of the biggest changes of the 2011 NFL lockout and subsequent collective bargaining agreement was the introduction of mandatory slotting for rookie contracts. In addition to slotting, the players association consented to mandatory four year contracts for all draft picks with a mandatory team option for first rounders. The league certainly gave up some things in exchange – minimum cash spending to all players and stronger guarantees for top rookie contracts – but the net effect was a severe restriction in the cash available to rookies.

A lot of analysis has been written about the value of draft picks in this new era. I am guilty of printing a few words on the topic myself. Bill Barnwell’s recent NFL trade value column  highlighted the incredible value of a rookie contract by placing Cam Newton, Colin Kaepernick, Russell Wilson, Andrew Luck and Robert Griffin III among the most valuable assets in the league.

One attribute of the new system, however, is being downplayed in most of the analysis out there: the restriction on renegotiation ends with the final game of a player’s third season. I expect the agents for Newton, Kaepernick, Wilson, Luck and Griffin have the Monday following week 17 this year (Newton and Kaepernick) and next year (Wilson, Luck and Griffin - and Brandon Weeden) circled on their respective calendars.

The calm descended over younger players’ contracts is a lull before the first wave of elite players hits the end of their third season. At that point expect lots of contract extensions with big guaranteed money. Colin Kaepernick is probably aware that Joe Flacco signed an extension with $60 million coming in the first three years while Kaepernick himself is scheduled to earn $740,844 in salary this year (the remainder of his cap hit comes from amortized bonus).

Teams certainly have leverage in the extension negotiations given the additional year plus a fifth year option for first rounders, but NFL teams always have leverage with the franchise tag lurking. Look for bargaining to split between those who take care of their young players quickly – buying off the immediate pain with higher cap hits down the road – and those who drag it out, risking a holdout or very unhappy player to control costs. The scope will be relatively limited as fewer players have leverage the way that draft picks do (what draft pick has ever underperformed before suiting up?). Those who have do have leverage based on their on-field performance will have it on par with the top picks of the old system.

The pending big extensions for Newton and Kaepernick won’t diminish the value they have provided in their first three seasons, and structural features such as the franchise tag will help maintain some surplus value for teams in new deals. These extensions should, however, make it clear that teams that hit the jackpot on their picks got a three year bargain contract rather than five.

Thursday, August 29, 2013

Returns to inequality in sports


Now that the last of my posts on returns to income inequality is up seems like the time for a quick reflection on the concept overall and how well it explained the success of teams.

The returns to inequality

The NBA is where the inequality of a team appears to make a difference in the expected success. This fits with the narrative that teams need to have a star (or several) rather than a surplus of role players. In all of the other leagues analyzed it does not make a significant difference. The NFL and MLB show a negative coefficient. Inequality harms a team in those two leagues. The NHL – most similar to the NBA in salary structure and individual player leverage – is the only other league to show a positive correlation between inequality and team performance.


This whole analysis is necessarily limited. The cumulative build-up of a team’s salaries can only tell us so much (R-squared values MLB=0.13, NBA=0.32, NFL=0.07, NHL=0.13) about the way they perform on the field/ice/court. It is a prediction, sometimes made years before, and made either under duress as part of a bidding process for a free agent or dictated by the terms of the collective bargaining agreement to a draft pick.

Still, it is interesting that one of the coefficients was significant while two others were close (p-value 0.2) after controlling for overall team spending. Even if it just confirmed what people already “knew” it was interesting enough for me.

Looking at a metric more-strictly focused on performance like WAR for baseball or Win Shares for basketball is problematic because end-of-season numbers incorporate the ups and downs of actual performance, so the team’s sum total matches to the performance. For 2012 (or 2012-13 for basketball) the WAR correlation with run differential is 0.89 while the Win Shares correlation with point differential is 0.997. These metrics are very good at allocating out the runs (points) to match their actual totals after the fact.

Unfortunately for us, the effects of a transcendent star making others better – or of a well-balanced team attacking weak links in opposing defenses – are already baked into these backward-looking metrics. To be useful we would need to look at the pre-season expected totals. Perhaps in a future post.

Monday, August 26, 2013

Returns to inequality in the NHL


Take a look over here if you want to get the background for this series, otherwise read on. 
Sports + Numbers Prediction: "I am guessing that returns to inequality are strong here too, with relatively high leverage of the individual players resembling the NBA more than the NFL or MLB." 
The data 
To see the impact of inequality we will look at each team’s Gini coefficient against their winning percentage, controlling for team spending. The resulting equation gives us an r-squared value of 0.13 with only salary spending being significant (P-value of 0.00008) while the Gini coefficient comes in at a P-value of 0.21.
Payroll vs Points % (total points / potential points) - NHL 2009-10 to 2012-13
For every million dollars in team spending the expected increase in winning percentage is 0.00397. For a team that spends $10 million more than a comparable team – all else equal – we would expect them to win 3 additional games (or win 2 more with two additional overtime losses (or win 1 more with four additional overtime losses (or win the same number but have six additional overtime losses))).
Gini vs Points % (total points / potential points) - NHL 2009-10 to 2012-13
On inequality the - insignificant - coefficient is 0.19. Within the range of Gini coefficients in baseball (0.22 to 0.47) this would mean a difference of 8 points (4 wins but I’ll spare the rest) from the most equal to the least equal (more wins to the least equal). Not nothing but not exactly a huge impact. The gap in payroll ($30 million to $71 million) projects to a gap of nearly 27 points.
Payroll vs Gini (color-coded by points %) - NHL 2009-10 to 2012-13