Tuesday, May 13, 2014

Why didn’t the Browns draft a wide receiver?


Less than 24 hours after trading down to grab some extra picks and then trading back up to grab Johnny Manziel the Factory of Sadness got cranked up again and word leaked that Josh Gordon, Cleveland’s All Pro wide receiver, had failed a drug test and would be facing a full season suspension. As someone who grew up in Cleveland let me just say that none of this was surprising.

What WAS surprising to some people was that the Browns, holding the 3rd pick in the 2nd round, didn’t draft a WR there. Not only did they not draft one at the 35th pick, they didn’t pick one through the rest of the draft.

In the medium- to long-term the Browns will certainly need some help at WR now that it seems they can’t count on Josh Gordon. For help with this season, however, the draft pick would have almost certainly been a non-factor – especially after they passed on Sammy Watkins and Mike Evans in the first round. 

Average 1st Season AV by Round Drafted

Position
1
2
3
4
5
6
7
C
4.0
2.9
1.2
1.9
1.2
0.4
0.6
DB
4.3
3.1
2.0
1.4
1.1
1.0
0.9
DE
4.7
2.1
1.6
1.5
1.2
0.5
0.7
DT
4.0
2.1
1.5
1.1
1.1
0.8
0.5
G
4.1
3.0
2.1
1.6
1.1
0.9
0.9
LB
5.9
3.6
1.9
1.4
1.0
0.8
0.8
QB
3.8
2.3
0.6
1.2
0.3
0.4
0.2
RB
6.7
4.2
2.7
1.9
1.1
1.2
0.4
T
5.2
4.6
2.0
1.4
0.8
0.7
1.2
TE
4.1
3.3
1.9
1.8
0.9
0.9
0.7
WR
5.2
3.1
1.6
1.4
0.7
0.3
0.5
Total
4.9
3.1
1.8
1.5
1.0
0.7
0.7

 
The fact that the Browns drafted a T at the 35th pick seems even better with the immediate need for help on the line and ability of tackles to contribute right away. WRs in the first round show strong performance, but those in later rounds underperform the average 1st year AV.


For reference, the averages for different levels of performance are:
 
Highest Performance
Avg AV
AP
13.6
PB
11.1
Starter
6.6
Roster
1.4
 
Finally, the list of wide receivers to deliver more than 10 units of AV since the 1994 draft is relatively short and heavily weighted to round 1. For most of the 20 years in the data set (11, to be precise) there are 0 receivers who reach 10 AV. There are 11 picks in the other 9 seasons who hit that threshold (Josh Gordon had 11 in 2013):
 
Year
Pick
Player
Tm
AV1
2013
76
Keenan Allen
SDG
10
2011
4
A.J. Green
CIN
10
2011
6
Julio Jones
ATL
10
2009
22
Percy Harvin
MIN
12
2006
252
Marques Colston
NOR
10
2003
54
Anquan Boldin
ARI
10
2001
36
Chad Ochocinco
CIN
16
1998
21
Randy Moss
MIN
17
1996
7
Terry Glenn
NWE
13
1996
18
Eddie Kennison
STL
10
1995
8
Joey Galloway
SEA
12

None of this means that Cleveland doesn’t need some help at WR. The Browns’ GM Ray Farmer knows it’s an issue and is likely looking at a number of different options including free agents. The fact that he passed up the crowd-pleasing WR pick to stay true to where he and the Browns’ front office team had players slotted should encourage fans that he has a strong process for finding the necessary support.

Friday, May 9, 2014

2014 NFL Draft - Day 1 Trades


As a fan of trades in the NFL Draft and a fan of the Cleveland Browns, the first round on Thursday night was particularly enjoyable for me. 

As we look at the trades, it’s important to remember that the Sports + Numbers value chart is related to the value of the pick alone – so any trades will likely offer some surplus to the team that trades down. The size of that surplus will vary and help determine which trades are big wins or losses. The classic Jimmy Johnson chart is based on trades that took place so it should include the surplus already.


Buffalo trades up to #4 with Cleveland
CLE receives: 92% of a #1 pick
BUF receives: 73% of a #1 pick 

Winner: Browns receive 26% more than they traded away, equivalent to an early 3rd round pick as surplus

Let me be clear: the Browns absolutely fleeced the Bills on this. The numbers above hold only if you assume the standard NFL rule that next year’s pick is worth a round less than this year’s – with an implied discount rate of about 140%. If you set that at 20%, still high for a business, the Browns got back 109% of a #1 pick and a surplus of a late 1st round pick. If you start to think about how bad Buffalo might be next year, you can talk yourself into even more value as the Bills sent Cleveland next year’s 1st and 4th round picks along with the #9 pick to move up 5 spots.

Wednesday, May 7, 2014

Draft performance by position


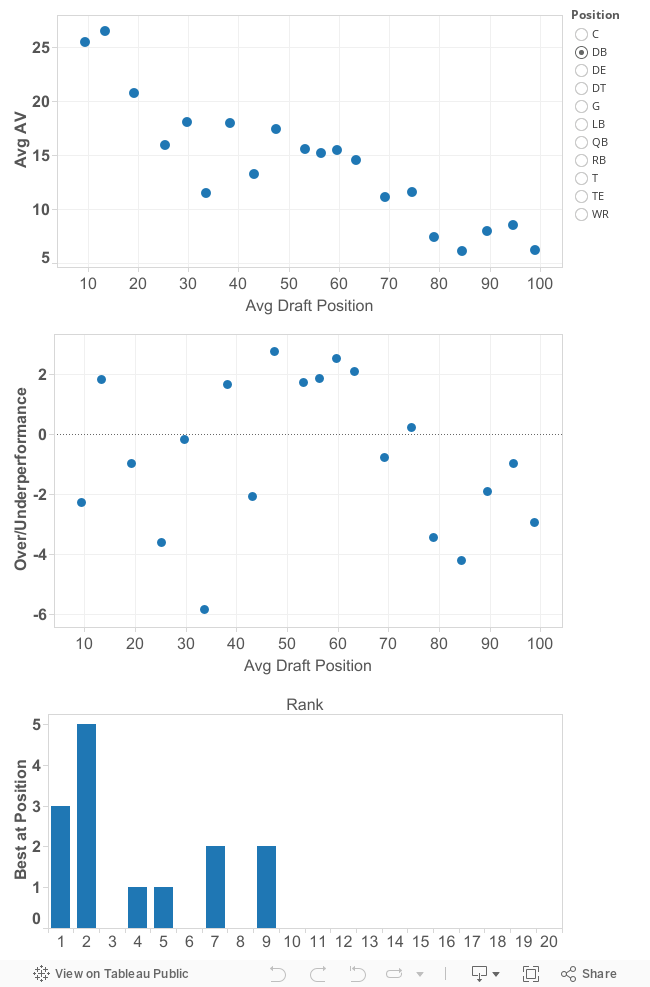
Yesterday’s post looking at the drop-off in value from the first to the second player off the board at each position was a bit of a tease. I fixed the overreliance on tables with a Tableau visualization (find it here) and now it’s time to make the cross-position comparisons begged by the data.

To start with, I want to change Approximate Value. The distribution built into the stat is the allocation of Draft Value to each position according to the Jimmy Johnson chart. Keeping the total points of AV the same, I’m going to redistribute by salary instead. From my database of salaries 2001 to 2012 I will pull the “starters” at each position. This means I’ll take the top 32 QB salaries, the top 64 Guard salaries, the top 128 DB salaries etc – resulting in the distribution shown below:


This makes a lot of sense to me. You hear a lot of talk about Russell Wilson’s extremely low salary helping the Seahawks allocate money elsewhere. This is absolutely right. With elite QBs routinely pulling down ~$18-20 million he is a steal at under $1 million.

You do not hear nearly as much talk about Luke Kuechly being a steal for the Panthers. He is, of course, a steal for the Panthers, but his making $3.4 million against the cap in 2014 while elite LBs top out at James Lauranaitis’ $10 million and no one else exceeds $7.5 million.

Given that we can pull together an expected value for the first four years in terms of Adjusted AV, which looks a lot like this:


Applying that back to every pick we can now compare how well positions do relative to the expectations for each pick that actually took place. That’s complicated, but at least the visual is simple. 


Quarterbacks show up as a good choice, because they deliver value that’s worth more in the marketplace. TEs adjust downward significantly, as expected. WRs and DBs, the two positions identified yesterday as having top picks that fail to outperform the next player off the board at their position, bounce all over the place as player value is hard to predict. Defensive Ends have an interesting trajectory with early picks underperforming, but players in the second round being well above expected value. Feel free to play with this and see what other patterns are (or might be) there.

NFL Draft Output by Position - Tableau

Just for fun, here's a visualization of the NFL Draft data that I talk about here and here. 


A note on the AV calculation presented here - it's weighted by position based on the league's aggregate level of spending on starters (e.g., top 32 QBs, top 64 DTs, top 128 LBs) over the 2001 to 2012 period for which I have salary data.  That approach gives TEs a pretty raw deal (-32%) since big deals have yet to trickle down despite a couple years of good performance, but makes a big positive adjustment to QBs (+61%) reflecting - accurately, I think - their importance in the league. Other than those two most adjustments are within +/- 10%.